Performance and Benchmarks
Performance
While USB disks, drives, sticks or keys, whatever terminology you prefer are now ubiquitous and are the portable storage of choice thanks to their compact size, large capacity and convenience the actual level of read/write performance between different USB storage devices which use Flash Memory varies significantly.
Some manufacturers do not want the consumer/user to be aware of the actual performance level of their products due to fear of such products being ignored and to proceed with using cheaper components, especially for entry level or value products.
While it is common practice and acceptable for a given manufacturer to have a wide range of product with varying performance from average to high performance, this does not excuse a vendor from not disclosing performance information for these products.
In addition, some mainstream technology publications will not reveal performance levels due to ignorance, lack of knowledge and desire to satisfy sponsors and advertisers, leaving readers in the dark about the true nature of a product they are considering for purchase.
The performance of USB Flash drives can be classifying in several ways.
- Read and Write throughput in Megabytes per Second
- A multiple of 1x CD-ROM read rate, such as 80X or 150X
- Input/Output Operations per second
- Whether the controller chip in the device uses single or dual channels to access the flash memory storage
- The technology used within the flash memory storage chips themselves, being Single-level cell (SLC) and Multi-level cell (MLC). Cheaper devices use the slower but higher capacity memory chips based on MLC design versus the smaller capacity but faster SLC design with the difference being how much data cab be stored within each memory cell in the memory chip.
Typically, throughput in MB/s is the most common way to describe the performance of flash memory storage such as USB drives or flash memory cards for cameras and media players. Flash memory cards such as Secure Digital (SD) have their own formalised method of describing the performance for a card consisting of classes but this will not be covered in this particular review.
The aigo McLaren USB disk does possess any specific performance related data on its packaging or documentation. The only hint to performance is a brief notion of ‘high performance’ in the product documentation and marketing text.
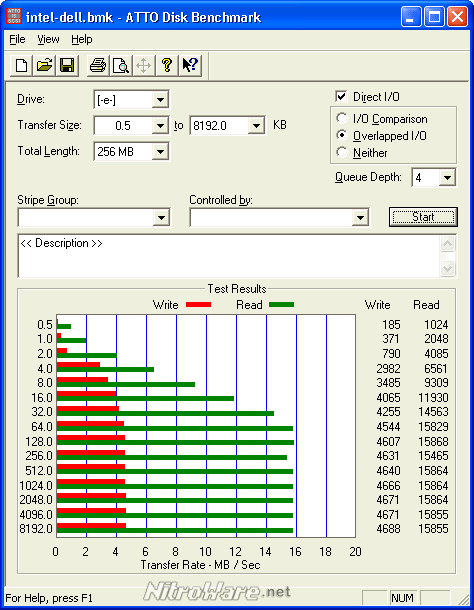
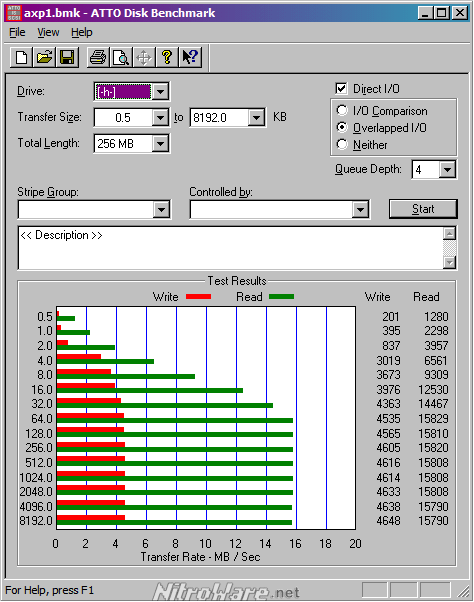
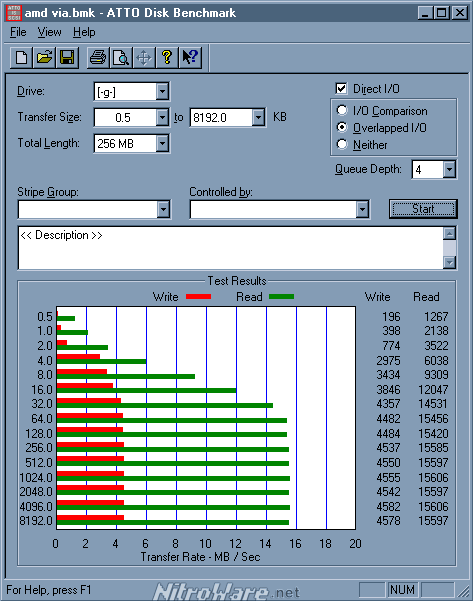
Our testing has revealed that this disk is capable of Reading at 15MB/s maximum and Writing at 5MB/s maximum which is equivalent to 100X, a satisfactory and acceptable level of performance. However other USB sticks with the same throughput speeds can be had for a quarter of the price.
For a product inspired by a successful and winning racing team, we expected that the device would at least be dual channel and capable of class leading performance in the range between 20-30MB/s reads and 10-20MB/s writes, such as the ‘Rally’ USB drive from OCZ, Corsair’s Flash Voyager series and even SanDisk’s Ducati Extreme USB disk which is capable of this level of throughput and is a direct competitor to the aigo McLaren product in the field of motor racing branded computer products
To benchmark the device and to determine its performance we used some standard benchmark tools that are widely used by technology media and vendors to determine these metrics.
Our result and testing methodology should be reproducible by our readers and other publications. We test using real world platforms consisting of disk images represent of an average user, that is a fully configured operating system with a selection of installed applications and utilities such as system utilities, internet and productivity applications. We do not test using a fresh, bare bones operating system installation.
A typical user should be able to experience their purchase by installing it using the prescribed manner and it should just work, without any unnecessary reformatting or complex configuration.
We tested this USB disk on chipset's from three of major vendors of system chipset's with USB 2.0 controllers; Intel, NVIDIA and VIA Technologies under Windows XP with Service Pack 3.
The performance of a USB storage device is dependant on the controller and flash memory within the device (such as this USB disk), the USB 2.0 controller within the system and its device drivers. While the system CPU does play a part in determining the percentage of CPU utilisation used to access the device since USB uses a polling technique in its operation, transfer rates should be within a margin of error regardless if the system containing the USB 2.0 controller is an elderly Intel Pentium III or the latest Quad Core systems from Intel or AMD.
Benchmarks
Test Systems
| Chipset | Platform | CPU | Main board | Chipset | USB 2.0 Controller |
|---|---|---|---|---|---|
| INTEL | Dell Optiplex GX270 | Intel Pentium 4 HT 3GHz | Dell Custom | Intel 865G | ICH5 |
| NVIDIA | White box | AMD Athlon XP 2GHz | Soltek 75FRN2-L | NVIDIA nForce2 Ultra 400 | MCP2 |
| VIA | White box | AMD Duron 1.3GHz | Gigabyte 7VA | VIA KT400 | VT8235 |
These three test systems provide a good cross section of typical machines which include USB 2.0 that are present in the field . Chipset from SiS or USB 1.1 performance was not tested.
Transfer Rate Test - ATTO32 benchmark
| Chipset | Maximum Read (MB/s) | Maximum Write (MB/s) |
|---|---|---|
| INTEL | 15.87 | 4.69 |
| NVIDIA | 15.83 | 4.65 |
| VIA | 15.60 | 4.58 |
| Average | 15.77 | 4.64 |


Transfer rate test - HD Tach 3 Benchmark
| Chipset | Random Access (ms) | CPU Utilisation % (-/+2%) | Average Read (MB/s) | Burst Speed (MB/s) |
|---|---|---|---|---|
| INTEL | 0.9 | 8.0 | 15.3 | 15.4 |
| NVIDIA | 0.8 | 5.0 | 15.5 | 15.7 |
| VIA | 1.2 | 8.0 | 15.4 | 15.7 |
| Average | 1.0 | 7.0 | 15.4 | 15.6 |
Transfer rate test - HD Tune 2.55 Benchmark
| Chipset | Access Time (ms) | CPU Usage (%) | Average Read (MB/s) | Burst Speed (MB/s) |
|---|---|---|---|---|
| INTEL | 0.9 | 6.0 | 14.5 | 13.1 |
| NVIDIA | 0.8 | 9.9 | 14.8 | 13.8 |
| VIA | 0.9 | 13.4 | 14.7 | 13.6 |
| Average | 0.9 | 9.8 | 14.7 | 13.5 |
Transfer rate test - Flash Memory Toolkit 1.2 Benchmark (KB/s)
| Chipset | 1MB Write | 1MB Read | 2MB Write | 2MB Read | 3MB Write | 3MB Read | 4MB Write | 4MB Read | 5MB Write | 5MB Read |
|---|---|---|---|---|---|---|---|---|---|---|
| INTEL | 3241 | 13944 | 3519 | 14406 | 3809 | 14565 | 3932 | 14646 | 4070 | 14761 |
| NVIDIA | 3689 | 14170 | 4030 | 14837 | 4204 | 15023 | 4299 | 15062 | 4341 | 15010 |
| VIA | 3066 | 14091 | 3138 | 14430 | 3532 | 14608 | 3744 | 14651 | 3860 | 14758 |
| Average | 3332 | 14068 | 3562 | 14558 | 3848 | 14732 | 3992 | 14786 | 4090 | 14843 |
Operations per second test - IOMETER benchmark
Maximum IO Operations test pattern - 512 size with 67% Reads
| CHIPSET | IOps | MBps |
|---|---|---|
| INTEL | 21.38 | 0.03 |
| NVIDIA | 20.68 | 0.01 |
| VIA | 22.07 | 0.04 |
| Average | 21.38 | 0.03 |
Default test pattern 2048 size with 67% Reads
| CHIPSET | IOps | MBps |
|---|---|---|
| INTEL | 21.14 | 0.04 |
| NVIDIA | 21.82 | 0.04 |
| VIA | 22.07 | 0.04 |
| Average | 21.68 | 0.04 |
Maximum Throughput test pattern - 65536 size with 100% Reads
| CHIPSET | IOps | MBps |
|---|---|---|
| INTEL | 222.43 | 13.90 |
| NVIDIA | 216.08 | 13.51 |
| VIA | 216.28 | 13.52 |
| Average | 218.27 | 13.64 |
What do all these benchmarks mean?
We use several similar benchmarks to verify that the results of a particular test gives are consistent with other similar tests. Unless the user or test is familiar with a single benchmarking or testing tool, the results of a single test program should not be taken alone as these different tests may report different results.
Different benchmark tools may utilise different test algorithms, methods and may be more or less affected by peculiarities in the test system such as installed hardware or software, how much time the processor is spending running the test , programs that are running in the background.
Our tests over three of the four major PC hardware [chipset] platforms using several popular benchmarking tools used in the industry to test storage devices conclude that our review unit was easily capable of reading data at 15MB/s (100x) and writing data at 4.5MB/s (30x) with large size files.
In comparison, a CD can be read between 3.6MB/s (24x) to 7.8MB/s (52x) depending on capability of the CD-ROM drive.
Flash Memory devices such as USB sticks/keys or Cards perform at their best with large file sizes and perform poorly with small file sizes. This is normal behaviour and the scope of which and which brands perform better with small file sizes will be covered in the future. Additionally, the characteristics of flash storage device change once the user loads some files onto the device and we tested with approximately of 800MB of assorted files consisting of application installers, device drivers , photos and media files such as video and audio.
The IO meter scores measure the number of operations per second. In essence this test can measure the efficiency of a storage or networking device. This test is useful for comparing storage devices or networking with similar specifications to see which device/test system is faster due to a more powerful design or better software.