Overall System Performance Benchmarks
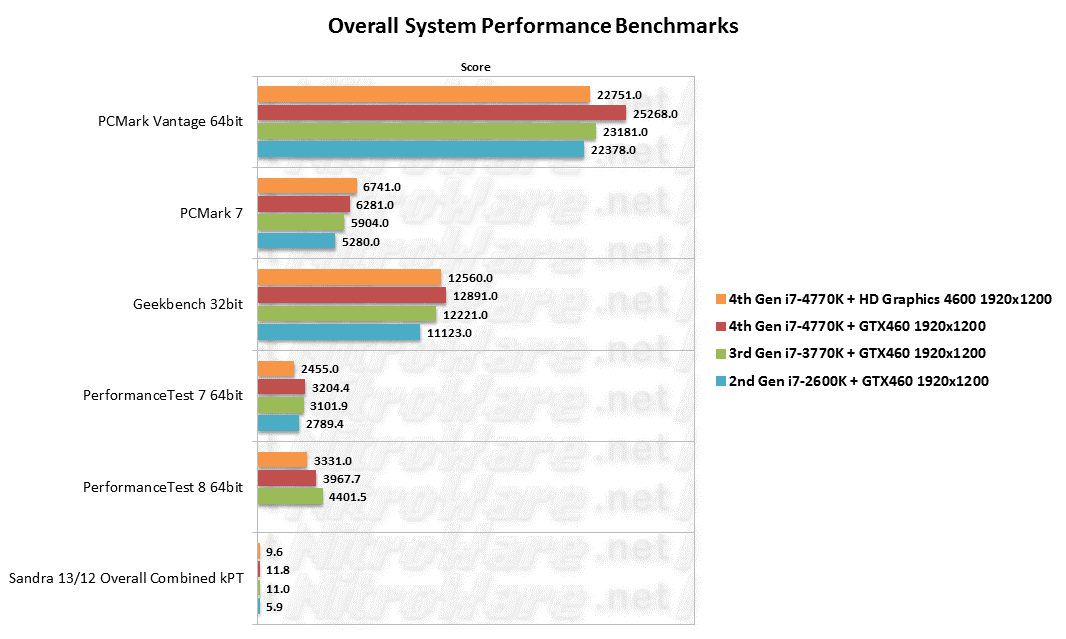
Popular System Performance Benchmark Suites. As mentioned previously, storage and video performance have a significant impact with PCMark.
PCMark shows the Intel Graphics enabled Haswell as fast as Sandy bridge, the reason of these high scores on HD 4600 is simple, the QuickSync engine is significantly faster in decode and encode than GeForce and as such biases the total overall score.
The Situation is even more evident for the newer PCMark 7 which has a higher emphasis on video performance. A deep dive into this performance difference will feature in our follow-up article
Geekbench is a cross platform CPU benchmark, also popular on Mac and Android. It is not influenced by the GPU at all but by the CPU and memory. AMD's 8 thread FX-8150 'Bulldozer' Part barely exceeds 10,000 in our launch testing
Like WinRAR we feature two versions of Passmark Performance test for comparative purposes. Version8 introduces newer 3D graphics tests as well as Compute and Direct2D. SSD performance has a huge influence here, with Performance Test reporting very different disk scores to every other benchmark.
SiSoft SANDRA is very frequently updated to support the newest CPU and GPU features, including AV2, OpenCL and Transactional Memory Support (not supported on our 4770K). The more performant GeForce's Compute power allows it to obtain first place.

Windows 7 Experience Index
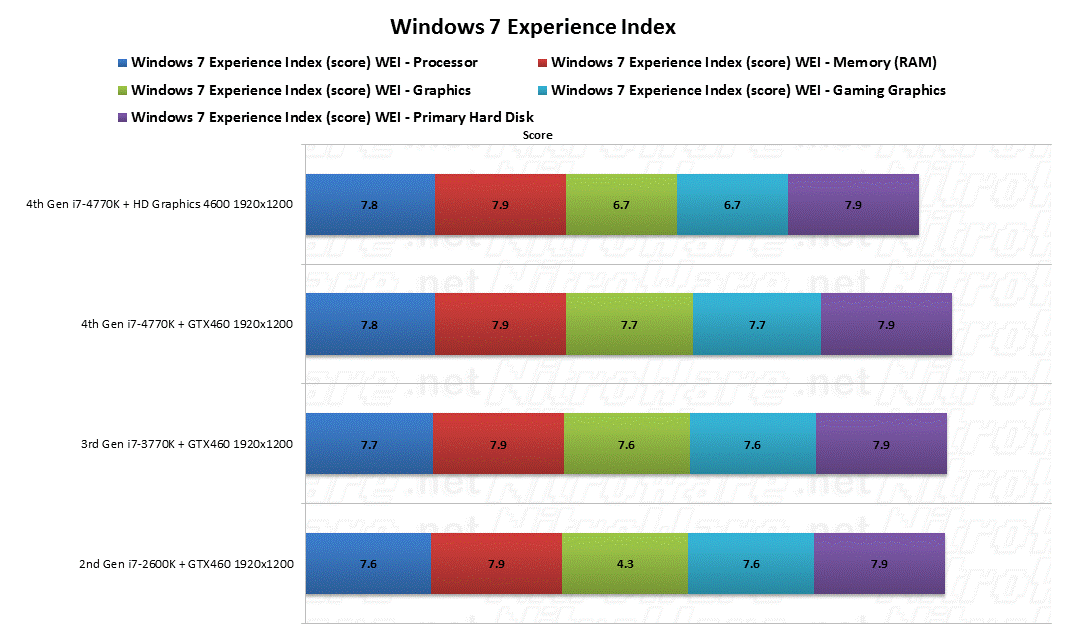
What might look like a simple and meaningless score that Vista,7 and Windows 8 present is actually much more complex than many realise. The scores themselves are merely a friendly summary and the raw detailed benchmarks are available for viewing as XML files in C:\Windows\Performance\WinSAT\DataStore or command line verbose output, WinSAT –v query to read the performance data already recorded in WinSAT's data store.
All aspects of the system are tested from AES and LZW throughput, to Memory bandwidth and latency, to Texturing and Geometry, Video Transcoding and Disk Sequential/Random Performance plus Access times.

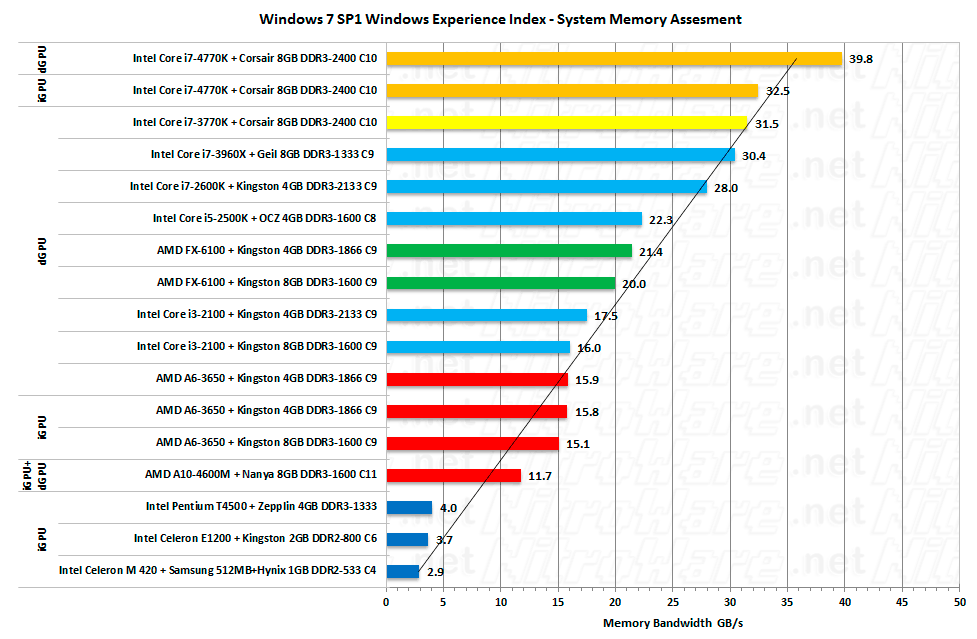
At 6.7 graphics, HD Graphics 4600 exceeds the 1st generation AMD "Llano" APU graphics performance of which the A6 model achieves 6.6. Note however all Integrated GPU solutions are memory bandwidth hungry.
Generally, memory 2133 and higher achieves 7.9 anyway regardless of capacity. Quad Channel with slower speeds modules also has an influence, presenting high total bandwidth.
